Discussion
Loading...

Post

  • About
  • Code of conduct
  • Privacy
  • Users
  • Instances
  • About Bonfire
DansLeRuSH ᴱᶰ
@danslerush@floss.social  ·  activity timestamp 2 weeks ago

#Report by the United Nations University quantifies, for the first time, the carbon, #water and land footprint of #AI. The figures are staggering : 945 TWh of electricity projected for 2030, 9.3 trillion litres of water, 14,500 km² of land.

Spoiler : It will take the water and electricity consumption of 1.3 billion people to meet your prompts by 2030

« ENVIRONMENTAL COST OF AI'S ENERGY USE - Carbon, Water & Land Footprints »

› https://collections.unu.edu/eserv/UNU:10647/UNU-INWEH-Report-The_Env_Cost_of_AI-2026.pdf (.pdf)

#UN #Energy #NoAI #Enslopification

View (PDF)
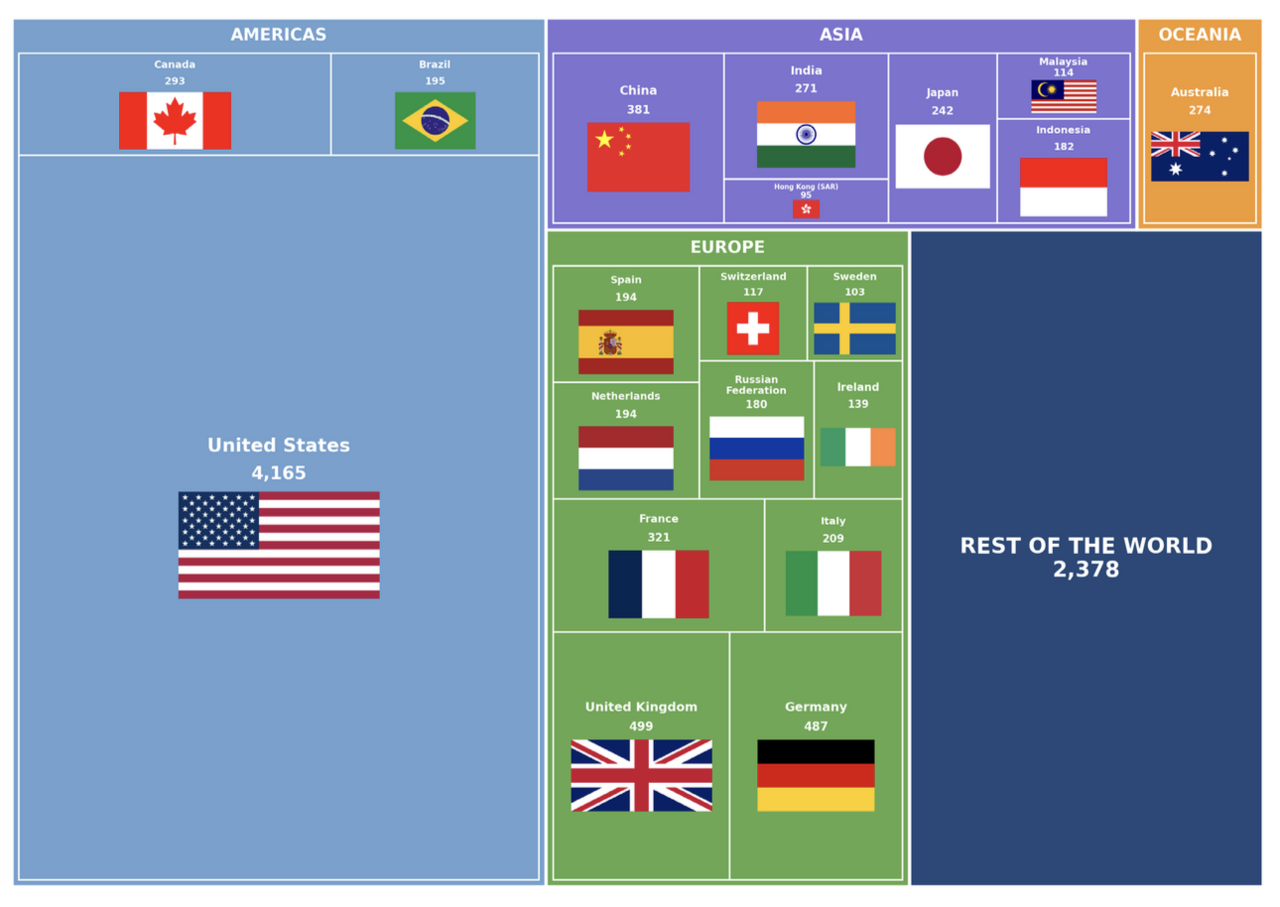
Nearly half of the world’s data centres are located in the United States. More than 150 countries have no data centres dedicated to AI.© UNU-INWEH 2026 / Cloudscene
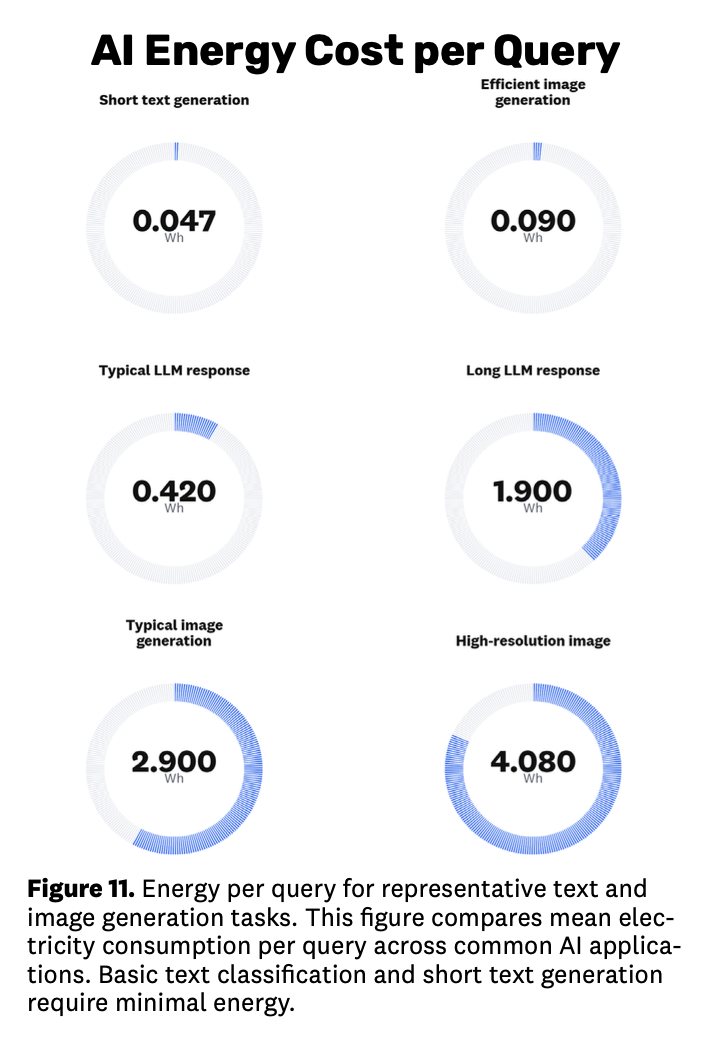
From text classification (0.002 Wh) to video generation (415 Wh), the energy consumed per query varies by a factor of 200,000.© UNU-INWEH 2026
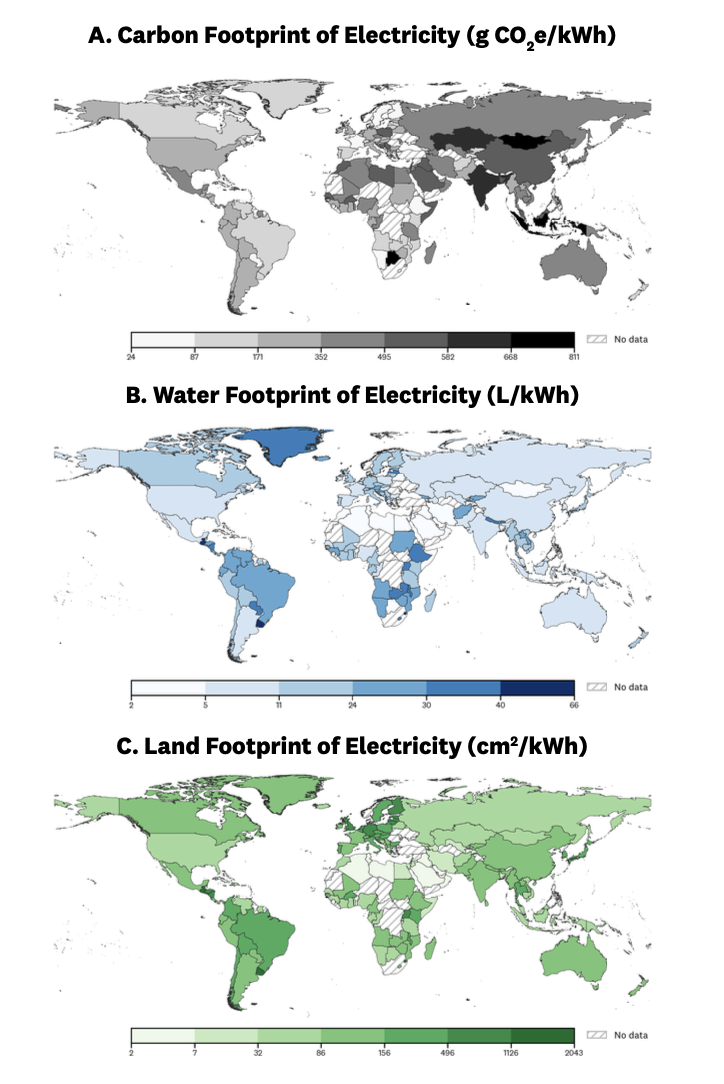
The environmental footprint of a single data centre varies considerably depending on the country in which it is located. At the top, carbon intensity per kWh. In the middle, water footprint. At the bottom, land footprint. © UNU-INWEH 2026
  • Copy link
  • Flag this post
  • Block
Log in

CoreSignal social

A minimalist social node dedicated to high-fidelity exchange and digital autonomy. CoreSignal strips away the noise of the modern web to provide a clean, functional space for meaningful connection within the Fediverse

CoreSignal social: About · Code of conduct · Privacy · Users · Instances
CoreSignal social · 1.0.0-rc.3.6 no JS en
Automatic federation enabled
  • Explore
  • About
  • Members
  • Code of Conduct
Home
Login